Having WordPress’ debug mode turned on when developing locally is always a good idea, as it allows you to write better code and catch potential bugs early. Sometimes, though, displaying the logs on the browser can be a hassle, as the warnings and notices might come from third-party code and fixing them would be out of scope. On those cases, a more practical setup would be something like that, in your wp-config.php:
// Enable WP_DEBUG mode
define( 'WP_DEBUG', true );

// Enable Debug logging to the /wp-content/debug.log file
define( 'WP_DEBUG_LOG', true );

// Disable display of errors and warnings
define( 'WP_DEBUG_DISPLAY', false );
The above would enable debug, but instead of displaying the errors and warnings in the browser, it would log them to a .log file under /wp-content/debug.log. If you are using PHPStorm, you can have the file open in a new window, keeping an eye on the log, which reloads every time that new entries are being added. The problem with that, though, is that it can be hard to distinguish the notices, the warnings, and the errors from the rest of the log’s messages.
The good news is that there is a plugin for that. Namely, Ideolog allows you, among other things, to highlight the log’s messages based on their log level: error, warning, notice etc.
The bad news is that the plugin doesn’t offer out of the box WordPress support. Instead, you’ll have manually add the Log formats yourself. To do so, you will have to follow the steps below:
- Install the Ideolog plugin
- Hit
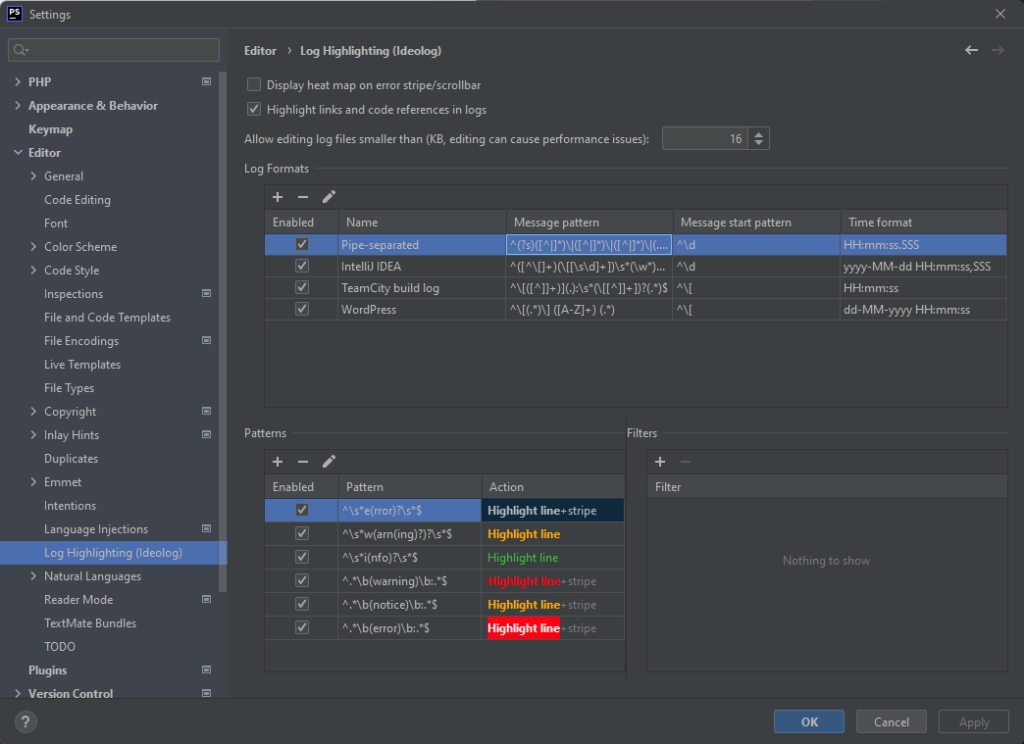
Ctrl + Alt + S(orCmd + Alt + Sif you are on a Mac) to open up the PHPStorm Settings, and then go toEditor → Log Highlighting. - To allow PHPStorm to recognize the log format, go under “Log Formats“, and add a new entry with the following options:
- Name: WordPress (it could be anything you like, actually)
- Message pattern:
^[(.)] ([A-Z]+) (.). - Message start pattern:
^[. - Time format: The format that your
debug.logfile follows, like for example:dd-MM-yyyy HH:mm:ss.
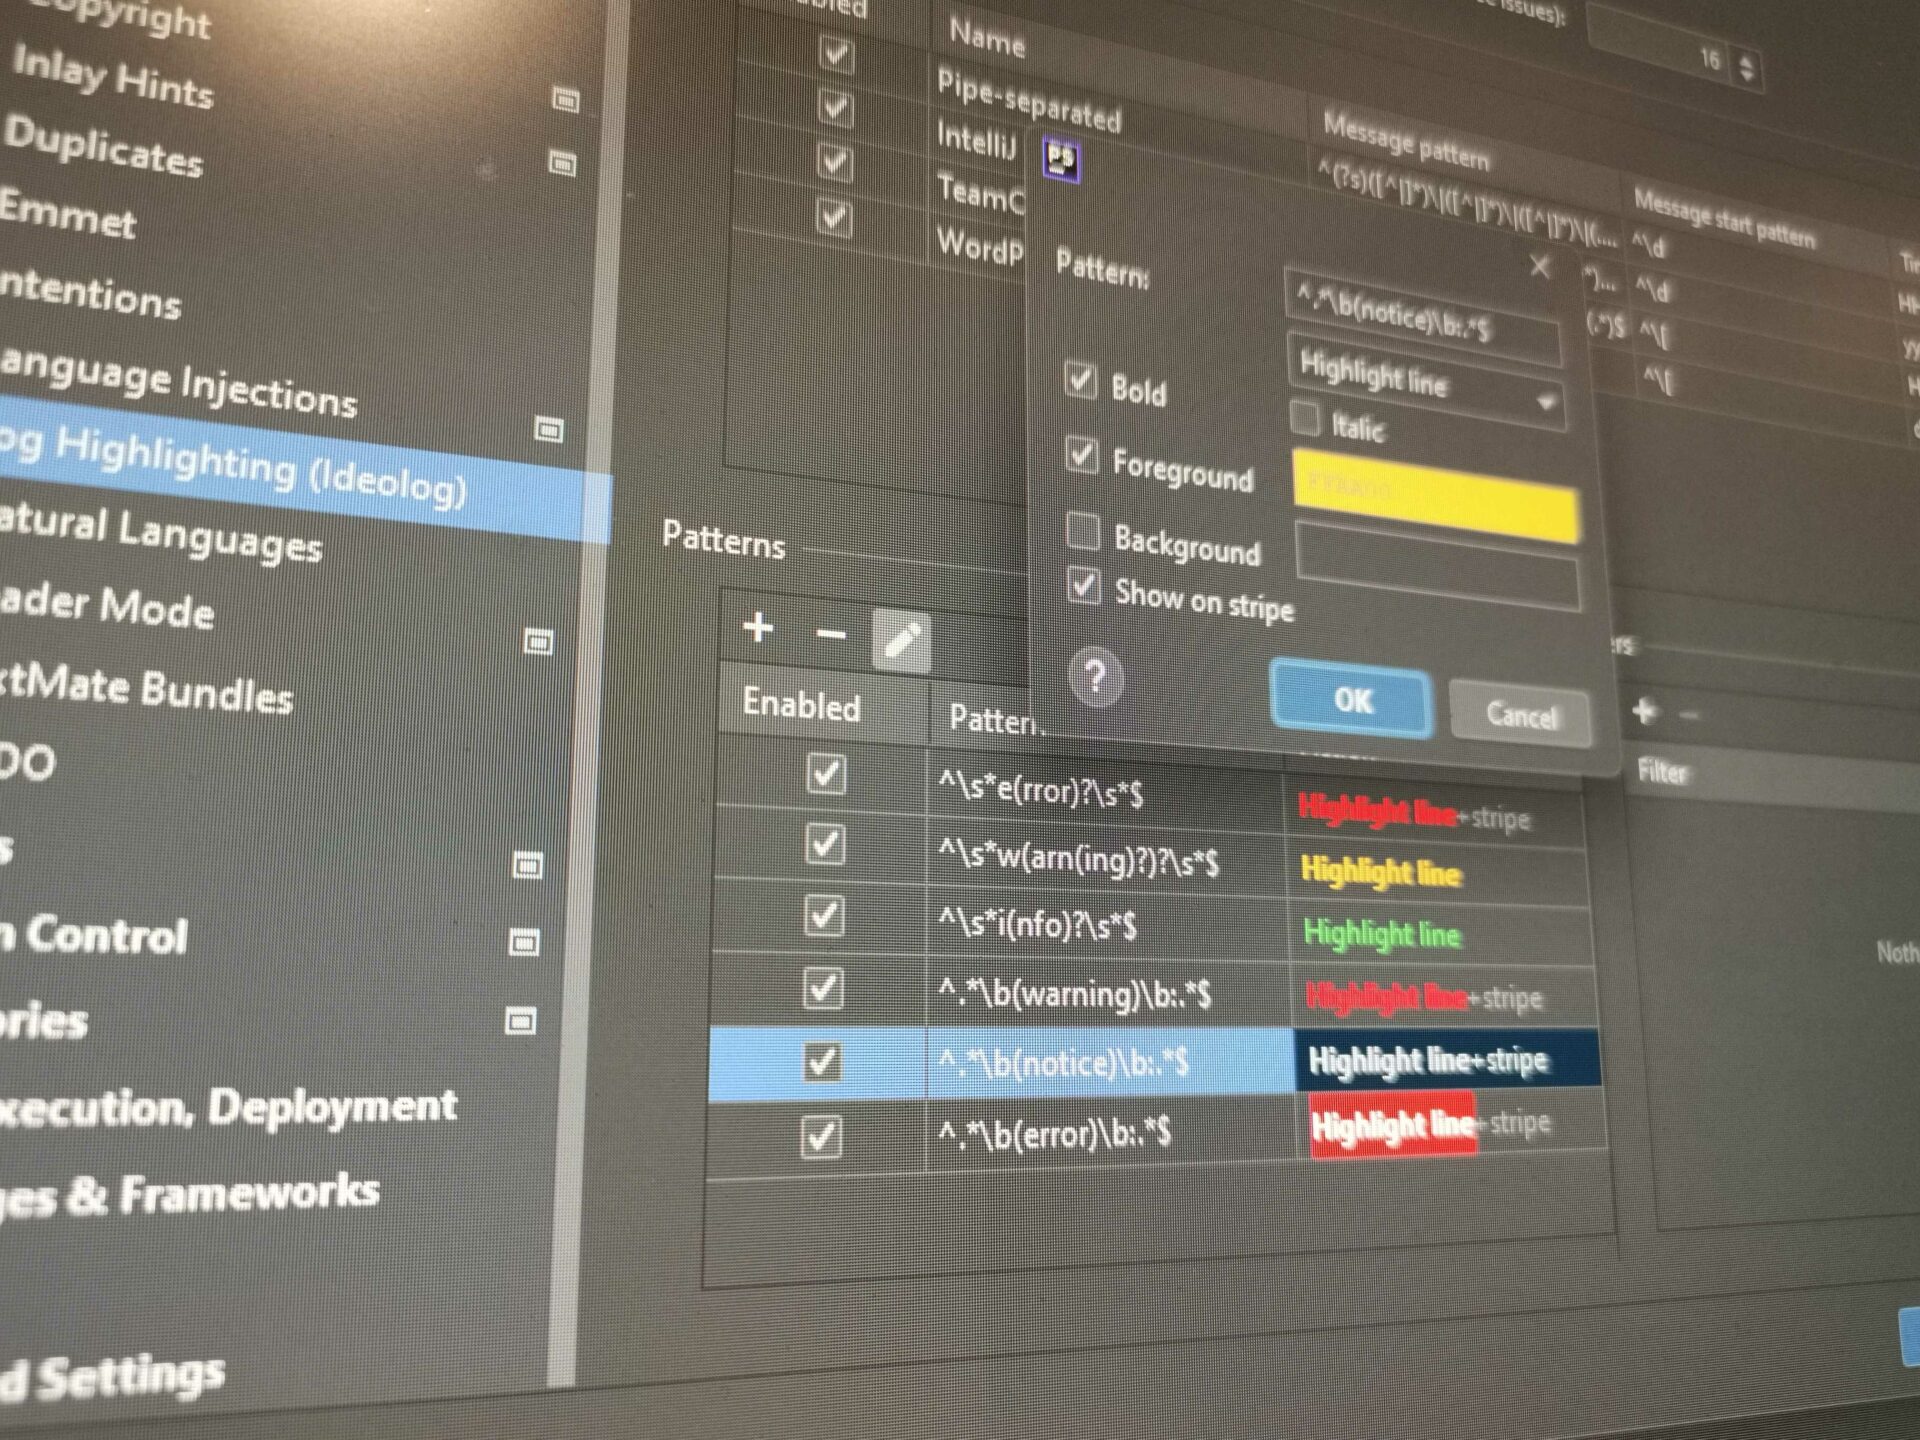
- To color-code the logs, go to “Patterns“, and add new entries for every type of log level that you’d like to highlight. The pattern should have the following structure:
^.\b(log_type)\b:.$. For example, to catch the warnings, it should be:^.\b(warning)\b:.$. The rest is easy, as all you need to do is select the formatting (colors, font weight) that you would want to apply to that specific pattern.
After doing so, when you open the debug.log file you will be able to easily track the important log events, based on the color coding that you have set:
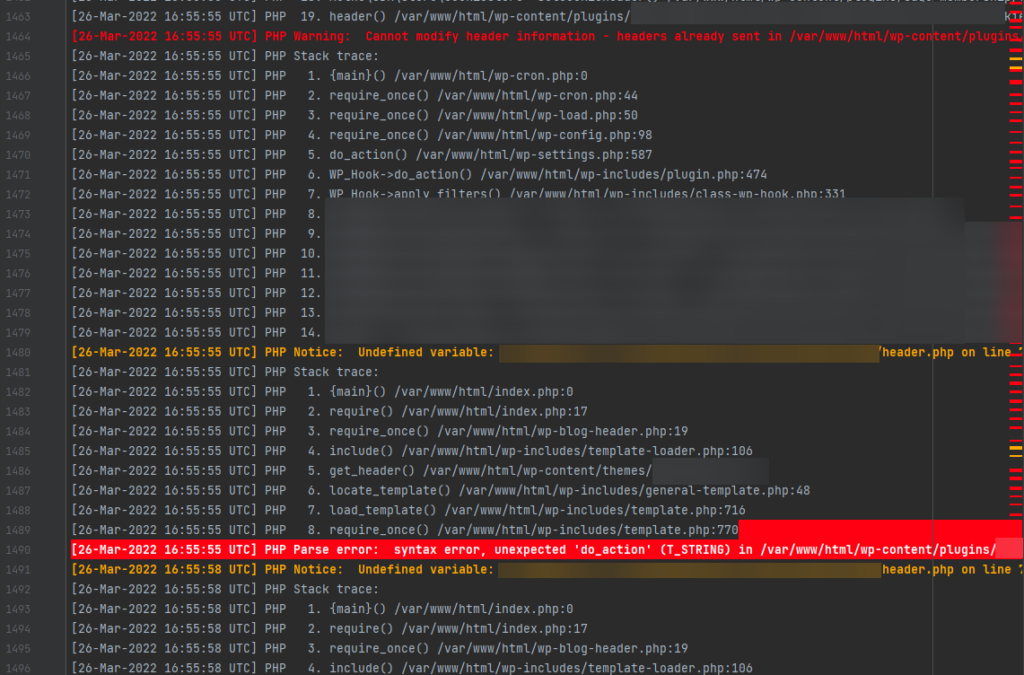
It doesnt work